So you've just bought a ThermaData 4-channel data logger? Now it's time to set up your instrument and start recording your temperatures. Read on to find out how, and how to download and display your data.
The first thing you'll need to do, if you haven't already, is download and install the latest version of ThermaData Studio software (v6.0.0.0).
Once you've done this, plug your thermaData recorder into the computer using the USB cable supplied, and open the software. A pop-up window should appear in the bottom right-hand corner to inform you that your instrument has been installed.
Select the ThermaData tab at the top of the page. Click on 'Instrument settings' to configure your instrument. From here, you can rename your sensors and set high and low limits for each, select your reading intervals, enable multiple logs and audible alarms, and select when you want your logger to start and stop taking temperatures.
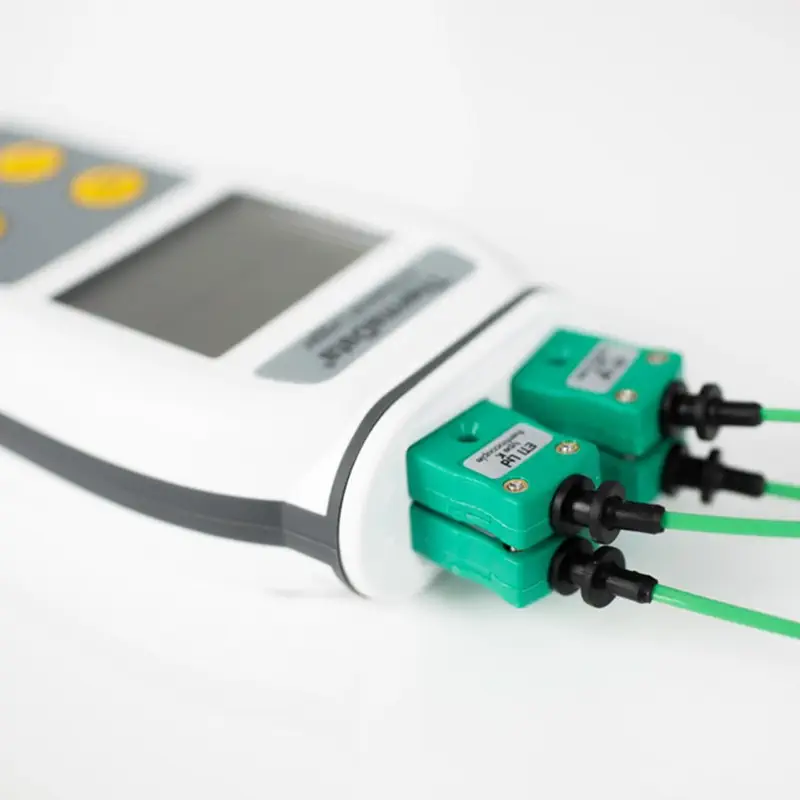
The top of the unit has four ports for each of your probes. The ports are numbered so you can see which probe corresponds to which sensor number on the unit. Make sure you have inserted your probes before starting a log.
You can program your thermaData recorder to start immediately, after a set delay or at a specific time and date. Setting a delay is useful for applications where the recorder may need to acclimatize before starting.
Once you've entered your settings and are ready to start the recorder, click on "Send settings" at the bottom of the recorder settings window. This will send your new settings to the device, erasing all existing instrument data in the process. A pop-up window will remind you that all instrument data will be deleted if you continue.
Once you have confirmed that you wish your new settings to be sent to the device, the instrument will display "Pres to Strt" or "Strt At XXhr XX".
If thethermaData logger displays "Pres to Strt", you can either press the instrument's start/stop button to enable it to start logging, or select the start button in the bottom right-hand corner of the Logger Settings window in ThermaData Studio. It will start logging immediately, or after a delay if you define one.
If the instrument displays "Strt At XXhr XX", it will automatically start logging at the time you set.
You can then disconnect the instrument from the computer.
The display shows two sensors at a time. Press the display button to toggle between viewing sensors 1 and 2, and sensors 3 and 4.
The display will show the last recorded temperature, minimum and maximum temperatures, high and low alarms for each sensor, as well as volume and battery levels.
To activate or deactivate the volume, press and hold the mute button for five seconds. To prevent the screen from flipping, hold down the display/lock button for five seconds.
You can program your ThermaData recorder to stop logging in several ways via the recorder settings when you configure the unit. You can set it to stop recording manually, when the ThermaData recorder is full, after a set number of readings or at a specific time and date.
If you have selected the manual option for your logger to stop logging, you can either click on the stop button in ThermaData Studio (if the logger is connected to the computer), or hold down the on/off button on the device for five seconds. Once stopped, the log is complete and ready for download.
If you've enabled the instrument to run multiple logs, you can press and hold the on/off button for 3 seconds. The display will then read "logX complete", and you're ready to record a new log by pressing Start. You don't need to download previous logs, as it will save them on the device for later downloading. You can do this up to 20 times, or until the instrument's memory is full.
If you haven't enabled the instrument to perform multiple logs, when the instrument stops recording, you'll need to download your data and restart the recorder in ThermaData Studio before starting a new log.
You can download your data at any time, without disturbing or corrupting recordings in progress.
To download your data, connect your recorder to your computer and open ThermaData Studio. Select the "Home" tab at the top of the page, then click on "Download".
To download data between specific periods, sensors or selected recordings, click on "Options" at the bottom of the "Save as" window. Once you've selected the format and location of your download and clicked on "Save", you'll be able to view your data in ThermaData Studio.
The "File" tab lets you print and share your data, or save it in another format (e.g. a Microsoft Excel document).
You can view your log results in several ways: via a summary, a graph or a data window. The summary and graph are displayed when you download your data, but you can also access them via the toolbar.
The data summary allows you to view your log settings, a summary of each log if you're in multi-log mode, alarm information and the option of recording notes.
The graph displays the temperature recorded by each sensor during the logging period. Each sensor appears in a different color, and you can select the sensors and logs (in multi-log mode) you wish to display on the graph via the right-hand side of the window.
Click on the "Data" tab in the toolbar to open the data window. A table will be displayed with the number of each log, the date and time of each log, and the temperature recorded for each sensor. In multi-log mode, you can scroll to view each log, or select the one you wish to view from the "Multiple logs" tab on the toolbar.
THERMADATA TD TEMPERATURE LOGGER
THERMADATA HTD TEMPERATURE AND HUMIDITY DATA LOGGER
THERMADATA HTDF TEMPERATURE AND HUMIDITY DATA LOGGER
TEMPERATURE DATA LOGGER THERMADATA TD2C


